If you want to succeed in online marketing, your website needs to be effective.
How do you tell if it’s actually working? Website performance metrics are the key.
The problem is there are so many metrics available through Google Analytics and other tracking platforms. It can be overwhelming to determine how your site is performing — or even which metrics you should track.
From bounce rate to page views, the metrics that form the shape of your site’s traffic can be hard to discern.
Plus, some of those metrics don’t really matter in the long run.
In this blog post, I’ll share 10 website performance metrics that will help you understand your site’s overall performance.
Why Is It Important to Track Website Performance Metrics?
Outside of the sheer financial or time commitment required to build and maintain a website, tracking website performance metrics provides an understanding of how users are behaving on your various pages.
By identifying actions and movements, you can see if they’re following the path you’ve pre-charted for them. If they’re not, you can adjust and optimize your pages to drive visitors to the conversion you’re aiming for.
Website metrics can also help you track and diagnose issues with:
- Effectiveness of your content strategy
- Keyword ranking
- The best traffic sources
- Paid ad success
- Conversion rates
Essentially, if you want to know whether your online marketing efforts are paying off, you need to track your website performance metrics. The exact metrics you track, however, can vary by industry, target audience, even where users are in the marketing funnel.
How to Identify Which Website Performance Metrics to Track
Website metrics provide a clear view of your business’ performance. While the term metrics may seem overwhelming at first, it shouldn’t; these figures can only help you.
Before you dive into tracking every available metric, first identify which metrics matter most to your business.
This can be ascertained by assessing your goals. If you’re hoping to skyrocket to number one on Google’s first page, you want to track metrics that align with search performance. That might mean tracking which keywords you rank for using a tool like Ubersuggest.
If your quarterly goal is to increase web sales, then you should track conversions, as well as how visitors are behaving on your site and when cart abandonment occurs.
In short, the metrics that you track should speak directly toward your goals. While it may be compelling to simply cherry-pick the metrics that reflect the rosiest image of your business, actual change and opportunity comes from identifying areas that need improvement.
Top 10 Website Performance Metrics to Track
While the metrics you track will depend on your individual goals, there are 10 website performance metrics that provide a 360-degree performance review, regardless of business benchmarks.
1. Website Speed
While the term website speed may simply conjure load time, insights into this particular metric actually go much deeper.
As attention spans shorten, you need to determine how your site is performing in a number of speed-related functions.
These include:
Time to Title
This time measurement refers to the amount of time from a visitor’s website request to the moment your site title manifests on the browser tab. This matters for visitors as a speedy title appearance ensures them that your site is legitimate.
Time to Start Render
This time measurement refers to the amount of time elapsed between a user request and when content materialized in-browser. Much like time to title, the quicker this happens, the more likely the visitor is to stay on the page.
Time to Interact
Referring to the time it takes from request origination and when the visitor can take an action (click on links, scroll page, type, etc.), time to interact is also vital when it comes to how long a visitor will stay on your site.
While there are more in-depth metrics associated with website speed, starting with these three can be the first step toward improving your site speed overall.
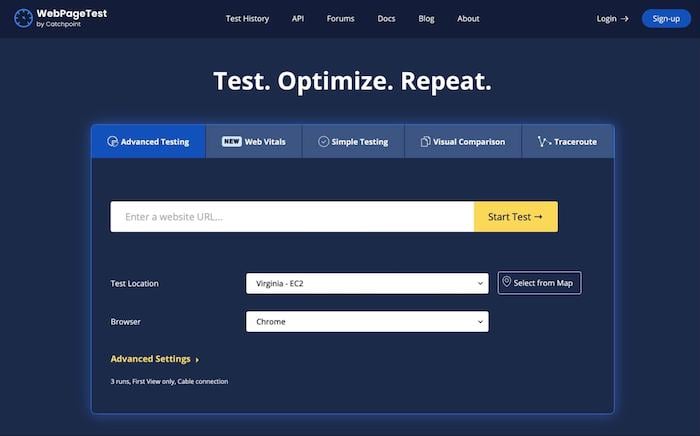
To find these numbers for your respective pages, you can use a free webpage speed test tool.

2. Number of Assets
The term “assets” refers to the materials that compose your page. Think: text content, audio, video, etc. Behind the scenes, each of these elements takes time to load. As you include more and more assets on a page, you can seriously slow down your page-load time.
There are many tools that assess the size of your page and assets. If you find that your assets are lowering load speed, you can always consider hosting them on an external site to speed up on-page load.

3. Error Rate
This metric tracks the percentage of request issues your site generates in comparison to the total number of requests. If you see a spike in these figures, you know you are about to run into a major issue. By keeping an eye on your error rate, you can diagnose and fix issues preemptively. However, without an eye toward your error rate, you can run into challenges that can take down your entire site and leave you correcting in real-time.
You can use a tool to track your error rate.

4. Bounce Rate
This metric refers to the number of users who are departing from your site shortly after arriving. In addition to impacting conversions and overall performance, a high bounce rate can have a negative impact on SEO since it can serve as an indicator that your site isn’t delivering what it promised.
To find your bounce rate via Google Analytics, navigate to Behavior>Site Content>Landing Pages Report, then scroll down to see bounce rates for individual pages.
Check out these tips to reduce your bounce rate.
To reduce your bounce rate, check out these actionable tips.
5. Unique Visitors
This term refers to a single browser that has accessed your site over a specified timeframe—this can be daily, weekly, or monthly. This metric is valuable as it indicates growth.
While there is benefit in repeat return visitors, if you’re focused on brand growth, you want to see your number of unique visitors rising steadily.
This specific metric is easily viewable through the Audience tab in Google Analytics account.
6. Traffic Source
When you track traffic sources, you can determine where your traffic is coming from, rather than just using volume alone.
This matters as it allows you to determine where your visitors are coming from; organic search, social media, or referrals. Ideally, you want to have an evenly-weighted bag when it comes to traffic sources. If it’s leaning more toward a specific source, you can adjust your content strategy to rebalance.
To see where your traffic is coming from, visit Google Analytics > Acquisition > All Traffic > Channels.
7. Conversion Rate
Convert, convert, convert is a common mantra in the marketing world. When you track your conversion rate, you gain viability into the quality of your leads, as well as how effective your website is as a whole.
For example, if you have a low conversion rate and a high traffic rate, you can infer that your on-page conversion tactics are not working as well as those off-site.
This information allows you to edit properties of your site to better meet the needs of your visitors.
To view your conversion rate in Google Analytics, navigate to Conversion and then Overview.
8. Top Pages Website
You always want to know which pages on your site are performing best—whatever best means for your particular goals.
To this end, keep an eye toward which pages are converting and which are not. By identifying what works, you can replicate that success in other pages across your site.
As you assess which pages are performing best, you should also track landing pages and exit pages.
Landing Pages
These are the pages that users land on when they enter your site. Since we all know there’s no second chance at a first impression, these pages need to be optimized and perform seamlessly.
To check out how these pages are running, access Google Analytics then Behavior, Site Content, and Landing Pages.
Exit Pages
An exit page is the last page a user visits before ending their session. By identifying these pages, you can better optimize them, encouraging visitors to stay longer.
To explore your exit pages, go to Behavior > Site Content > Exit Pages.
9. Keyword Ranking
Although keyword rankings are in constant flux, a sudden, deep drop can be cause for concern.
Of all the SEO metrics to track, keyword ranking should top your list.
Why?
These terms allow you to double-check that your SEO strategy is working and can help you tangibly measure your progress.
Looking for a tool to help you track these metrics? Ubersuggest can help.
10. Lead Generation
You know lead generation is vital to your organization’s growth. You also know how challenging lead generation can be, not to mention a nebulous space to navigate.
To help you gain a more analytical view of your lead generation strategy, there are three key website performance metrics that you should track: bounce rate, average session duration, and click-through rate (CTR).
While we unpacked the bounce rate above, here’s why you should track CTR and average session duration.
CTR
This metric identifies what percentage of site users interacted with a specific CTA and is vital in determining overall lead success.
Average Session Duration
This metric refers to the average amount of time a user spends on your site. A longer duration indicates highly-engaged users, while the opposite signals changes and optimization are necessary.
Website Performance Metrics Frequently Asked Questions
How do you measure website performance metrics?
Website performance metrics can be aggregated through Google analytics or a number of other external tools that can help site owners gain a 360-degree view of site performance.
What are the best KPIs for a website?
The best KPIs for a website include click-through rate (CTR) and average session duration.
How much does it cost to track website performance metrics?
Regardless of your budget (seriously, you can track website performance metrics for free), there are price-ranging tools that can track website performance metrics.
How much time does it take to track website performance metrics?
While viewing your site’s performance can take just a matter of seconds, to have a true understanding of your site’s efficacy, you need to have a longitudinal assessment of your site’s performance over time.
Website Performance Metrics Conclusion
Whether you’re building a brand-new website or simply hoping to optimize your existing site for better performance, the above 10 website performance metrics can help you gain a clear view of user behavior on your website, as well as how your site is running overall.
By optimizing functions you can control, like site speed and number of assets, you can make your site much more user-friendly, encouraging visitors to spend more time on your pages.
While you can’t technically control how your visitors behave on your site, you certainly can optimize content to drive behavior.
What are the best website performance metrics you use to gauge efficacy?
from Blog – Neil Patel https://ift.tt/3nlfuzY

No comments:
Post a Comment